Intrigued by David Smith's Facebook friends network analysis using the Rfacebook package, I decided to try it out on my own group of friends, to see if my social circles are clique-y ala North Shore High School.
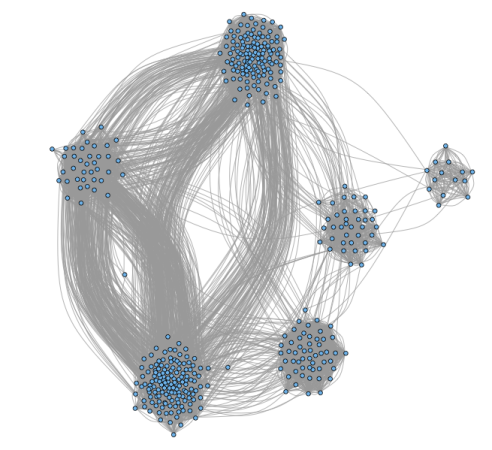
It turns out the social circles in my network were visualized almost perfectly! The smallest group to the far right of the graph contains family members, the large group at the top contains current co-workers, and the large group at the bottom contains friends in the Austin cyclist scene. Other clusters are friends from high school, friends from college, and bar friends. The most isolated group is my family. The groups with the most connections to each other are my current coworkers, cyclists, and bar friends, which makes sense, because they are roughly in the same age group and live (or have lived) in Austin, a fairly connected city. Now I'm wondering how to get the data to see if Austin really is more connected than other cities or if it's just in our collective imagination.
Thanks to David for the tutorial on graphing social networks and to Julianhi for his tutorial on setting up Rfacebook.
Comments